How Social Media Trends Are Driving Retail Forex Market Sentiment

The powerful force of social media now shapes how people think as well as their behaviors and the decisions they make about their finances in the modern high-tech world. Internet users began with content sharing, and social media evolved into a massive platform for financial discourse through which common people discuss tactics and market projection. The digital revolution in retail forex markets caused a complete transformation that affected trading sentiment and decision processes beyond what experts predicted in 2010.

The foreign exchange market strategies of retail traders heavily depend on four social media platforms: Twitter, TikTok, Reddit, and Instagram. Modern social media posts, tweets, and videos disseminate rapidly between users, which transforms into viral sentiment-based trends. Trading platforms changed as market understanding shifted from technical charts to fundamental analysis,
because the newest market sensations come from trending hashtags and viral content which influence market shifts. The fusion between technology and the community foundation prompted the emergence of investors who measure financial decisions through market sentiment combined with statistical data.

Reddit and Telegram offer retail traders access to online communities through which they experience belonging. Trading platforms have created communal areas for novices to gain experience from professional traders while collaborating with others during the sometimes overwhelming process of forex trading. Community building has created a new dimension in trading which allows people to experience both a sense of disconnection and connection with a group of investors who strive for mutual targets. The social connections between retail traders tend to be empowering, yet they have the potential to amplify feelings which may result in group-thinking behavior or spur uncalculated choices. The environment of the social media space displays the strongest power of retail forex sentiment formation.

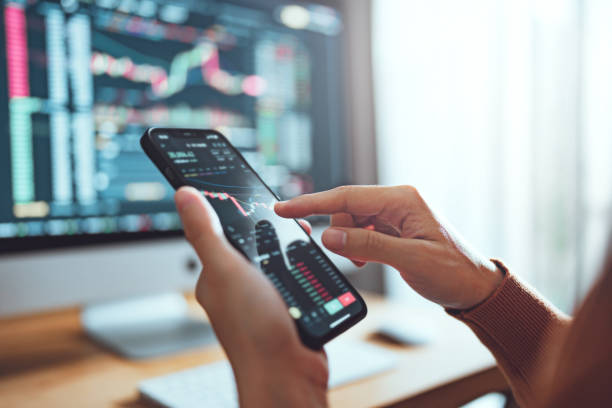
This rise in popularity of FX trading stems primarily from how social media has gotten people involved. Brokers together with trading platforms have responded to this trend by developing simple tools and mobile applications with social trading options that enable users to duplicate trades made by powerful individuals. Social media users taking part in live trading broadcasts and observing influencer results creates an atmosphere of opportunity that encourages new participants to join. Online stories about macroeconomic subjects and sophisticated models now seem accessible to more people due to the data that flows through social media networks.

Social media provides instant feedback because it immediately shows shifting retail forex market sentiments. The social media community reacts rapidly to unexpected geopolitical events in the form of tweets and viral predictions of currency collapse, which drive immediate buying and selling patterns. Traders must exercise extra caution when navigating their strategies, because market
volatility rises from social media activity. People differ in their abilities to navigate the fast-paced nature of social media either by capitalizing on real market signals or getting overwhelmed by them.

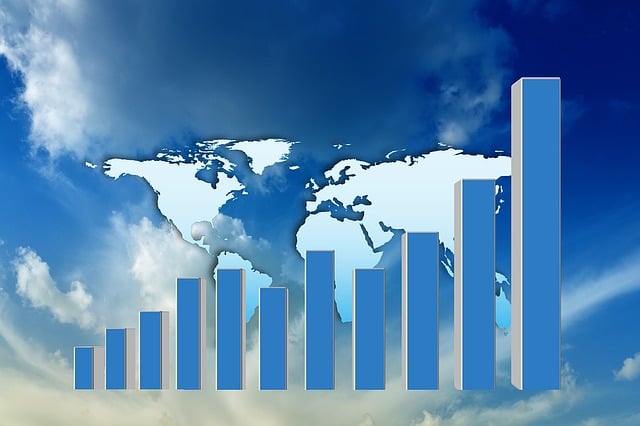
Several financial sectors have changed due to social media, yet FX trading stands out because of its constant global activity. The forex market functions without fixed trading timeframes which allows it to serve as the optimal trading environment for those who seek fast responses to online shared events. Trading in the current retail marketplace reflects social communication patterns tied to fast-paced market information exchanges that generate market sentiment from basic economic principles.

The impact of social media on retail forex sentiment will expand during future developments of this technology. Using the tsunami of information successfully will be traders’ main consideration in the upcoming years. Trading success in the FX market belongs to those who combine timeless analytical methods with knowledge of social interaction patterns.

Using Pine Script to Develop Custom Indicators for Dutch Stocks

Netherlands-based academic institutions utilize Pine Script through its unique stock analysis indicators to assist their investors. Investment community members in the Netherlands utilize TradingView charts to perform market analysis activities. Pine Script enables users to develop custom indicators that enhance their experience and refine strategies which conform to individual investor targets. By using Pine Script traders can self-define their indicators to better visualize patterns, trends and specific signals which matter for Dutch stocks analysis.

Users access Pine Script as the built-in language within TradingView for writing their technical indicators alongside building alerts and developing trading strategies. Users who are Dutch investors develop Pine Script-based indicators that reflect their individual trading methodologies to monitor both single Dutch businesses and widespread market conditions. This flexibility allows investors to tailor their analytical tools precisely to the dynamics of the Dutch stock market.

The development of customized indicators using Pine Script is a major advantage for Dutch investors. Through TradingView charts investors gain a simple operable platform that permits testing different scripts while modifying parameters to observe chart transformations in real-time. Real-time indicator testing on Pine Script helps Dutch traders develop their indicators and enhance their trading decisions. Users can develop both basic moving averages and sophisticated trading strategies involving multiple conditions and performing calculations through Pine Script.

A successful process to build Pine Script indicators requires both programming expertise and technical analysis skills. When evaluating Pine Script, one can find straightforward features together with many sophisticated options in the system structure. The combination of price data with volume indicators as well as time frame modifications becomes accessible through Pine Script for Dutch
investors who conduct their analysis. The ability for TradingView to display results transforms processes into interactive experiences that draw the attention of various traders.

The programming capabilities of Pine Script help users design their own alert system. Users can program the scripts to trigger automatic notification alerts based on market condition specifications. Pine Script notifies Dutch investors through alerts when specified price targets are met or trend patterns get triggered for their monitored stock. Traders avoid prolonged screen monitoring through this system which keeps them updated on market movements. Custom alert functions in Pine Script allow Dutch investors to streamline repetitive trading tasks which frees their time to make strategic decisions.

The Pine Script community includes many dynamic users that create and share their developed indicators and strategies. Dutch traders utilize a multitude of public scripting resources created by other users to discover new possibilities and develop their own projects. Anyone who uses Pine Script to improve trading will find valuable learning experiences by collaborating with members of the TradingView community.

Dutch investors now experience improvements in their trading experience because they can build custom indicators through Pine Script v3 technology. TradingView charts provide an optimal environment that showcases complex data visually and allows investors to evaluate their written code within real-time market conditions. Dutch investors can achieve market superiority through Pine Script as they develop indicators which match their individual trading strategies.

How to Trade With MetaTrader 4 on Mobile Without Losing Control or Clarity

Markets move around the clock, and opportunities can appear when you are far from your desk. That is why having access to MetaTrader 4 on your mobile device is not just a luxury; it is a powerful advantage.

Whether you are managing trades on the go or checking your positions during a commute, the mobile version of MetaTrader 4 gives you control and visibility from anywhere. The key is knowing how to use it effectively without sacrificing the precision and structure you are used to on the desktop version.

Getting Started With the MetaTrader 4 Mobile App

The MetaTrader 4 app is available for both iOS and Android devices. Once downloaded, you can log in with your existing broker credentials. The app connects directly to your live or demo trading account and syncs your data in real time.

The layout is clean and intuitive. It includes Market Watch, Charts, Trade, History, and Settings tabs. Navigation is fast and responsive, making it easy to monitor your account and take action when needed.

Monitor the Markets With Live Quotes and Custom Watchlists

The Market Watch tab displays a list of instruments with live bid and ask prices. You can add or remove symbols, rearrange them, and create a personalized watchlist.

For active traders, having quick access to frequently traded pairs or instruments saves time and keeps you focused. Tap on any symbol to open a chart, place an order, or view specifications like spread and contract size.

Trade With Confidence Using Real-Time Charting Tools

The charting function in MetaTrader 4 mobile supports multiple timeframes and basic indicators like moving averages, RSI, MACD, and Bollinger Bands. While the tools are more limited compared to the desktop version, they are more than sufficient for trade monitoring and execution.

You can switch between timeframes from one minute up to monthly and apply indicators by tapping the chart and selecting the settings icon. The pinch-to-zoom feature also allows you to focus on specific price zones or candles for clearer analysis.

Placing and Managing Orders With Ease

Placing a trade in MetaTrader 4 mobile is simple. Tap the quote of your desired instrument and select “Trade.” You can choose between market and pending orders, set stop loss and take profit levels, and view live spread information.

Once the trade is open, you can modify or close it from the Trade tab. All changes sync immediately with your broker’s server, giving you the same execution quality as the desktop version.

Stay Alert With Push Notifications and Alerts

To avoid missing key market moves, MetaTrader 4 mobile allows you to receive push notifications. You can enable alerts for price levels, news events, or trade activity. These can be sent directly from your desktop platform to your mobile device or set natively within the app.

This feature ensures that even when you step away from your computer, you remain connected to your trades and can act without delay.

Best Practices for Trading on the Move

Trading from your phone should not mean abandoning your discipline. Avoid making impulsive trades based on emotion. Use the mobile app primarily to manage active trades, confirm setups you have already planned, or close trades based on preset rules.

Having MetaTrader 4 on your mobile device gives you the flexibility to stay connected without losing control. With smart navigation, reliable execution, and real-time data, it becomes an essential tool for modern traders who need to balance freedom and precision.

Why Some Traders Keep a Chart of Silver Beside Their Desk

Silver doesn’t always get the spotlight. It often sits in the shadow of gold quieter, less discussed, and priced much lower. But for traders who follow market patterns closely, silver tells a different kind of story. One that speaks before other markets move.

That’s why some traders make it a habit to keep a silver chart open at all times. Not for show but for signals. The metal’s price movement often reacts to shifts in economic conditions, currency strength, and industrial demand. When these things start to change, silver tends to move early.

Unlike gold, which is mostly driven by safe-haven flows, silver has a foot in both worlds. It’s seen as a store of value, but it also plays a big role in industrial production. That dual nature makes its chart more dynamic, sometimes unpredictable, but also more informative. Traders looking for signs of market stress or recovery find clues in silver before they appear in broader indexes.

In precious metals trading, silver stands out for its volatility. A small shift in demand or supply can push the price quickly in either direction. For short-term traders, this creates opportunity. For long-term watchers, it helps map out the bigger picture. In both cases, having the chart nearby isn’t just useful it’s strategic.

Silver’s relationship with the US dollar and interest rates adds another layer. When the dollar weakens or inflation expectations rise, silver tends to follow gold upward. But unlike gold, it may respond more sharply to industrial demand, making it sensitive to manufacturing data and economic sentiment.

That means the metal isn’t just a follower. It can be a leader. Its movements can hint at upcoming changes in energy costs, tech demand, or even global supply chain issues. For traders who build positions based on global trends, this information is valuable.

There’s also the gold-to-silver ratio a tool used to compare the two metals. When this ratio stretches too far in either direction, some traders expect a reversal. Watching silver helps them spot that imbalance and decide whether to shift strategies. It’s not a perfect science, but it adds depth to decision-making.

In many trading setups, silver plays a supporting role. But just because it’s second to gold in value doesn’t mean it’s second in importance. Its price movements often lead or lag in a way that gives early insight into sentiment. For those who rely on technical patterns and intermarket analysis, this kind of lead time is crucial.

Precious metals trading isn’t just about chasing big headlines or reacting to economic news. It’s about seeing the quieter signals. A spike in silver volume, a break above a resistance level, or a divergence from gold’s movement can all say something. Traders who keep a chart open learn to recognise these signs with experience.

Some even use silver as a confirmation tool. If other markets suggest uncertainty but silver remains stable, that stability may act as a warning or a signal to hold back. If silver breaks out alongside weakness in equities, it might suggest a deeper shift in risk appetite.

Not everyone gives silver this much attention. But those who do understand its unique place in the market. It doesn’t always shout. It doesn’t always follow the rules. But when it moves, it often moves with purpose and ahead of the crowd.

So while it may not be the loudest chart on the screen, silver earns its place beside the desk. It speaks in quiet tones, but for traders tuned into its signals, it often speaks first. Its movements can highlight shifts that broader markets haven’t reacted to yet. In the hands of a patient trader, that early signal can make all the difference.

The Metal Moves That Quietly Signal What’s Coming

Some market signals are loud: a central bank rate change, a major earnings report, or a sharp move in the stock index. Others are quiet, almost easy to miss. But in those quiet shifts, metals often speak before the rest of the market listens.

Gold, silver, and other metals tend to move ahead of big events. It’s not always a sharp spike. Sometimes it’s a steady rise or a slow decline. But traders who follow these charts know that changes in metal prices often reflect underlying tension before it appears elsewhere.

That’s because metals are tied to deep parts of the financial system. They respond to inflation fears, currency shifts, and sudden global risk. When the future feels uncertain, money often flows into safe assets. Among those, gold has a long history of being seen as a shelter.

But silver, platinum, and palladium also offer clues. They don’t just follow gold’s lead. Each metal has its own demand and supply story. Silver is linked closely to industrial use, especially in electronics and solar energy. If its price starts rising quietly, it could signal strength in the production sector or even supply concerns ahead.

The ability to spot these early movements is part of what makes precious metals trading so strategic. Traders aren’t just watching for price gains. They’re reading what those gains might mean. If gold starts climbing during a time of calm, it often suggests tension is building under the surface.

One example is when bond yields and gold rise together. This is rare, but when it happens, it often points to market confusion or a shift in expectations. That type of move tells traders that something unusual may be developing. It’s not a guarantee of anything, but it’s a flag worth noticing.

Trading these metals through contracts or digital platforms has made access easier. You don’t need to store physical bars or coins to get involved. This opens the door for fast reactions, even to small shifts. But it also means volatility is higher, and risk needs to be managed carefully.

That’s why many traders use a mix of tools when working in this space. They look at charts, monitor macro news, and compare metals to related markets like currencies and energy. These links help them understand not just what’s moving, but why it’s moving now.

Some people think of precious metals as slow or outdated. But their movement is often early and accurate. In the lead-up to a recession or geopolitical shock, these prices tend to adjust before other markets catch up. That makes them a useful part of a trader’s toolkit, even if they’re not the focus of the trade.

In some cases, metals also point to recovery. A rise in industrial metals can signal confidence returning to global manufacturing. A steady rise in silver, paired with strong energy demand, may indicate upcoming growth in green sectors. It’s not always about fear. Sometimes, it’s quiet optimism.

Precious metals trading isn’t just about making quick gains. It’s about staying alert to signals that others might ignore. A shift in the gold-to-silver ratio, a new production policy from a major mining region, or a change in central bank gold holdings these are all small clues with big implications.

Traders who follow these moves often do so with patience. Metals don’t always react immediately. But when they do move, they often do it with purpose and with a story behind it. Reading that story takes more than just a price chart. It takes awareness of what each metal stands for and how it fits into the wider system.

So the next time gold rises without clear cause, or silver gains strength in a quiet market, take note. The move may not make headlines. But in the world of metals, quiet changes often speak the loudest especially when the rest of the market hasn’t caught on yet.

Comparing Mobile Trading Apps of Top Forex Brokers

Mobile trading has moved far beyond simply monitoring charts on the go. In 2025, many traders prefer their phones or tablets over desktop platforms. The experience is fast, intuitive, and fully integrated into daily routines. But not all apps are created equal. The trading experience you get depends heavily on which FX broker powers the app you’re using.

The interface can make or break the experience

Let’s face it. If you need to tap through five menus just to place a trade, that app’s not cutting it. The best FX broker mobile apps focus on clean interfaces, customizable layouts, and one-touch execution. IC Markets, for instance, offers a sleek experience that mirrors its desktop counterpart. Traders can manage positions, analyze charts, and switch between accounts with zero friction.

Pepperstone’s app is another standout. It loads quickly, updates in real-time, and supports mobile MetaTrader platforms with smooth transitions. Layouts are logical, price feeds are fast, and the overall user experience is simple yet powerful.

Execution speed remains essential

No matter how polished the app looks, performance under pressure is key. An FX broker that understands mobile trading ensures that orders placed via smartphone are just as fast and reliable as those made from a desktop. Speed matters most during news events, volatile market conditions, or in situations where every second counts.

Brokers that maintain server stability and low latency across mobile platforms provide a massive advantage. Whether it’s closing out a risky trade or entering a breakout, the right app can help you move decisively when timing is everything.

Tools that go beyond the basics

Charts, indicators, and watchlists are no longer “nice to haves.” Today’s traders expect full analytical capability even on a 6-inch screen. The best mobile platforms integrate real-time technical indicators, multiple chart types, and trading signals, all without sacrificing speed or simplicity.

Some apps now offer full strategy testing tools, economic calendars, and price alerts directly within the platform. A FX broker that embraces this kind of functionality understands that mobile trading isn’t just a backup; it’s the primary tool for many.

Security features you can trust

With trading accounts often linked to thousands of dollars, mobile security is a serious issue. Leading apps now include two-factor authentication, biometric login, and encrypted communication protocols. A reliable FX broker won’t just offer these, they’ll make them a mandatory part of your login process.

You should never need to question whether your funds are safe when trading from your phone. Strong security adds confidence and lets you trade freely without second-guessing the platform’s integrity.

Choosing the right app means choosing the right broker

Ultimately, your mobile experience is only as good as the infrastructure behind it. An intuitive app backed by unreliable servers is still a liability. When selecting an FX broker, don’t just download the app and take it for a spin; look into the company’s execution history, platform reliability, and customer support as well.

In today’s fast-paced market, mobile trading isn’t just convenient, it’s essential. And with the right broker-app combo, you’ll never have to miss a trade, no matter where you are.

How Monetary Policy Decisions Shape Long-Term Market Trends

The central banks lead financial markets toward economic stability by influencing economic growth through monetary policy. The long-term trends shaping global markets develop from three primary measures: interest rate adjustments, liquidity measures, and inflation controls. Financial institutions and policymakers are directly influenced by these decisions, which affect the broader business industry and consumer impacts. Market reactions from monetary policy adjustments control the speed of economic cycle movements.

Interest rate adjustments implemented by central banks generate major impacts on all financial institutions in the system. Economic growth occurs when rates are reduced for stimulus purposes, whereas rising rates control price increases by restraining overconsumption. The market adjustments from interest rate adjustments shape bond yields together with currency values and stock prices, thus creating fresh business prospects and operational difficulties for both traders and investors. Global economic networks make it possible for single-country economic choices to generate market waves, which cause changes in international trading relationships along with capital transfers.

The monetary direction of the market depends on the continuous observation of policy statements and economic data by market participants. Market unpredictability exists because central banks reveal their future direction through forward guidance procedures. Several elements, including financial market opinions, commercial challenges, and global events, determine market reactions. Sectors sensitive to interest rate changes face uncertainties that present both risks and opportunities arising from market unpredictability. Investors wishing to adopt long-running investment plans need to comprehend how official policy changes affect different investment categories throughout extended periods.

The currency markets react strongly to any changes in monetary policy. A currency tends to strengthen when interest rates rise because investors seek higher yields, but lower interest rates cause currency weakness because investors find lesser attractive. The influence of central bank choices produces a constantly shifting FX trading environment that forces traders to adjust their currency positions. A trader’s skill at analyzing economic data, together with central bank predictions, brings substantial opportunities to succeed in foreign exchange markets.

The core monetary policy objective to control inflation leads to vital market effects. Central banks tend to tighten monetary conditions after purchasing power decreases because of rapid inflation increases. Increased central bank interventions create diminished consumer economic activity, which leads to reduced corporate financial success and market atmosphere changes. The economy grows better during periods without inflation, but such times often reveal unrevealed market-demand problems. Market behavior throughout the long term gets molded by the outcomes from officials maintaining proper monetary equilibrium.

Financial market reaction to monetary policy changes is delayed, but their full effects become unmistakable over time. Strategic investors who analyze future market patterns examine policy developments spanning the duration from months up to years. The understanding between monetary policy and market trends shows why financial professionals need to monitor changes together with market response. The existence of successful trading and investment approaches depends on the knowledge of central bank actions when dealing with market cycles.

Modern financial environments depend on monetary policy as their determining shaping force that will guide their future development. Successful investment in FX trading and related fields requires knowledge about how market operations get influenced by policies. The market produces enduring conditions because of monetary policy, regardless of short-term volatility that results from unexpected policy announcements. The comprehension of central bank methods by financial market leaders enables them to make both strategic and confident decisions concerning monetary matters.

Why Market Liquidity Fluctuations Create Unique Opportunities for Traders

Market adaptation by traders strongly depends on liquidity fluctuations because these changes shape their trading approaches. Effective position entry and exit depend on both buyer and seller participation throughout the market. Smooth market transactions happen when liquidity levels are high because price slippage remains minimal, which produces an atmosphere of stability. When liquidity levels drop, market price movements become volatile, but knowledgeable traders benefit from these volatile conditions.

Market liquidity presents changes because of economic transformations, geopolitical events, and changing investor perception levels. Major news announcements, which include interest rate decisions or employment reports, trigger fast trader reactions that create temporary liquidity drops through position reassessment of market participants. Price volatility surges during such times, which exposes possibilities for individuals who can identify the upcoming market impacts. The availability of updated information combined with strategy adaptability gives traders an opportunity to benefit from market price inefficiencies that only last temporarily.

Some financial instruments demonstrate greater sensitivity to liquidity changes than others do. A lower stock trading volume leads to greater price fluctuations when large transactions occur in those stocks. Liquidity levels remain high for major currency pairs in foreign exchange markets because the market experiences continuous demand from all around the globe. Despite their resilience, FX trading markets are still affected by liquidity fluctuations. The foreign exchange market demonstrates strong shifts in its rates, especially during periods of economic instability, along with central bank interventions and sudden geopolitical changes. The monitoring of the forex market liquidity lets traders spot exclusive trading opportunities that might not arise in periods of stability.

Market psychology strongly influences the way liquidity changes. The confidence of investors leads them to actively trade in financial markets, which maintains heightened liquidity between participants. Market participants tend to decrease their market exposures when uncertainty enters the financial market, which results in periods of low liquidity. The conditions create unexpected price jumps and gaps, due to which new risks and trading opportunities emerge. Professional traders use their experience to react to price shifts originating from brief misalignments between market buyers and sellers.

Using technology has provided traders with expanded resources to research liquidity trends so they can adjust their strategies. Trading platforms that integrate advanced technology supply real-time data regarding order book visibility alongside trading metrics, which enable traders to make well-informed decisions. The FX trading platforms provide market participants with the opportunity to monitor currency pair liquidity levels, which helps them discover trading opportunities through supply and demand dynamics. Real-time access to such data changed trader approaches regarding liquidity-driven opportunities.

Market liquidity is impacted by regulatory policies that control its operations. Financial institutions, together with governments, establish regulations that affect asset purchase and selling freedom. Market engagement and position-changing abilities of participants are influenced by margin regulations, trading taxes, and capital restriction policies. The traders who track regulatory shifts gain competitive benefits because they modify their plans according to evolving liquidity dynamics.

The evolving financial markets will depend significantly on liquidity variations during trading. Unexpected liquidity changes present both challenges and unique opportunities for those who understand their price impact. Traders who stay knowledgeable about market transformations and adapt to shifting conditions can transform market amounts of change into positioning opportunities for their trading success within this constantly evolving market environment.

The True Cost of Running a Private Hire Vehicle in 2025

Running a private hire vehicle offers freedom, flexibility, and the chance to earn a steady income—but it also comes with a range of expenses. For new and experienced drivers alike, understanding the true cost of operations is key to staying profitable.

In 2025, the costs aren’t just about fuel and tyres. From licences to insurance, let’s explore the main areas where drivers spend money to keep their business moving.

1. Vehicle Ownership or Lease

Whether you buy your vehicle outright or lease it, the vehicle is your biggest investment. Most private hire drivers choose reliable, fuel-efficient models that suit their work. Some go for hybrids or electric cars to reduce running costs and stay compliant in clean air zones.

In either case, you’ll have ongoing monthly payments or depreciation to consider over time.

2. Fuel or Charging

How you power your vehicle will shape your weekly spending. Petrol and diesel vehicles need frequent refuelling, especially in stop-and-go traffic. Electric vehicles have lower fuel costs, but they require access to charging points and may involve longer charging times during your shift.

Either way, your energy use is one of the most consistent expenses in your daily operations.

3. Maintenance and Repairs

Even the best-maintained car experiences wear and tear. Tyres, brakes, oil changes, and servicing are part of running a vehicle full-time. The more miles you clock, the more frequently you’ll need to visit a garage.

In addition to regular maintenance, unexpected repairs—like a broken sensor or failed alternator—can pop up and affect your earnings if your car is off the road.

4. Hire and Reward Insurance

One of the most important—and required—expenses for private hire drivers is hire and reward insurance. Unlike standard car insurance, this policy is made for drivers who carry paying passengers.

It can covers accidents, passenger injury claims, and legal issues tied to your business. Without it, you can’t operate legally.

The cost of hire and reward insurance depends on your experience, location, vehicle type, and how often you drive. Working with a specialist provider helps ensure your cover fits your driving habits without overpaying. Some providers also offer flexibility for part-time drivers or those just getting started.

Keep in mind, hire and reward insurance is a non-negotiable cost—it protects you, your passengers, and your income.

5. Licensing and Compliance

Every private hire driver must meet local authority requirements. This usually includes:

  • A private hire driver’s licence
  • A vehicle licence
  • A background check (DBS)
  • A medical assessment
  • Regular MOT and vehicle compliance checks

These are recurring costs that vary depending on your local council’s policies. Staying compliant means keeping documents updated and following all rules that apply to your operating area.

6. Platform and Service Fees

If you drive through an app like Uber, Bolt, or Ola, you’ll pay service fees or commissions. These are usually a percentage of each fare and can affect how much you take home. Some platforms may also charge weekly access fees or deduct costs for cancellations or support services.

Independent drivers won’t pay platform fees but may invest more in marketing or customer loyalty incentives.

7. Day-to-Day Extras

Smaller costs also add up:

  • Keeping your car clean and presentable
  • Mobile phone data and chargers
  • Snacks, drinks, and rest breaks
  • Business cards or local ads if you’re self-employed

Though minor individually, these daily expenses have an impact when added up over weeks and months.

Conclusion

The true cost of running a private hire vehicle in 2025 goes far beyond just fuel and tyres. Success depends on understanding your full list of expenses, including regular servicing, platform fees, and especially your hire and reward insurance—a key part of running your business legally and safely.

When you’re fully informed and properly covered, your vehicle becomes more than just transport—it becomes a stable and profitable way to work on your own terms.

Learning Chart Patterns with TradingView Charts

Chart patterns are a cornerstone of technical analysis, offering valuable insights into market behavior and potential price movements. Mastering these patterns can significantly enhance trading strategies, and TradingView Charts makes the learning process intuitive and accessible. By leveraging its advanced tools and user-friendly features, traders can confidently identify, analyze, and apply chart patterns in their trading.

Understanding the Basics of Chart Patterns

Chart patterns fall into two main categories: reversal patterns and continuation patterns. Reversal patterns, such as head and shoulders or double tops, signal a potential change in the current trend. Continuation patterns, like triangles and flags, suggest the existing trend is likely to persist. Recognizing these patterns helps traders anticipate market shifts and plan their trades accordingly.

Identifying Patterns with TradingView

TradingView Charts provide powerful tools for spotting and marking chart patterns. Begin by selecting a candlestick chart, which is ideal for visualizing price action. Use the drawing tools to outline patterns, such as trendlines for triangles or horizontal lines for support and resistance levels. Switching between timeframes allows for a detailed analysis of both short-term and long-term patterns, ensuring a comprehensive view of market behavior.

Common Patterns to Master

Patterns like head and shoulders are widely regarded as indicators of trend reversals, while triangles often form during periods of consolidation, preceding breakouts. Double tops and bottoms highlight potential trend changes, and flags or pennants signal a continuation of the prevailing trend. TradingView’s charting tools make it easy to identify and annotate these formations, helping traders plan their entries and exits with precision.

Enhancing Pattern Analysis with Indicators

While chart patterns provide a visual roadmap, combining them with indicators can improve accuracy. Volume indicators confirm the strength of a breakout, while RSI identifies overbought or oversold conditions near key levels. Moving averages provide additional context for trend direction and strength, complementing the insights gained from chart patterns. TradingView supports the integration of these indicators directly on the chart for seamless analysis.

Practicing with Historical Data

One of TradingView’s standout features is its replay tool, which allows traders to revisit historical price movements as if they were happening in real time. This feature is invaluable for practicing the identification and interpretation of chart patterns without the pressure of live trading. By analyzing past market scenarios, traders can refine their skills and build confidence in pattern recognition.

Staying Proactive with Alerts

TradingView’s alert system ensures traders stay informed about potential pattern developments. You can set alerts for price movements near support or resistance levels, trendline touches, or breakout points. These alerts keep traders engaged and ready to act, even when they’re not actively monitoring the charts.

Learning Through Collaboration

The TradingView community offers a wealth of shared ideas and analyses, making it an excellent resource for learning chart patterns. Annotated charts from experienced traders provide real-world examples, helping newer traders understand how patterns form and how they can be applied. Sharing your own analyses and receiving feedback further accelerates the learning process.

Building Expertise with TradingView

TradingView Charts make learning chart patterns straightforward and effective. By providing advanced tools, real-time alerts, and collaborative opportunities, the platform equips traders with everything they need to master this critical aspect of technical analysis. Whether you’re studying patterns like triangles and head and shoulders or refining your skills with historical data, TradingView is an essential tool for developing expertise in chart pattern trading.